I’ve written previously about moves to reduce my carbon footprint.
I was wondering if it’s possible to get better electricity data… and it turns out it is. With thanks to a post on the Facebook “My Efficient Electric Home” group, it turns out the electricity distributors have a way for you to get half-hourly data from your smartmeter. (Links below)
My distributor is United Energy. Sign-up was pretty easy. It’s got some nice dashboards to look at recent data, and you can request a CSV dump of two years’ worth – which it provides in half-hour blocks.
Half-hourly is a bit much, but I crunched it into 7-day daily averages below. This shows July 2020 to July 2022, and I’ve tried to match it up with what might have affected usage.
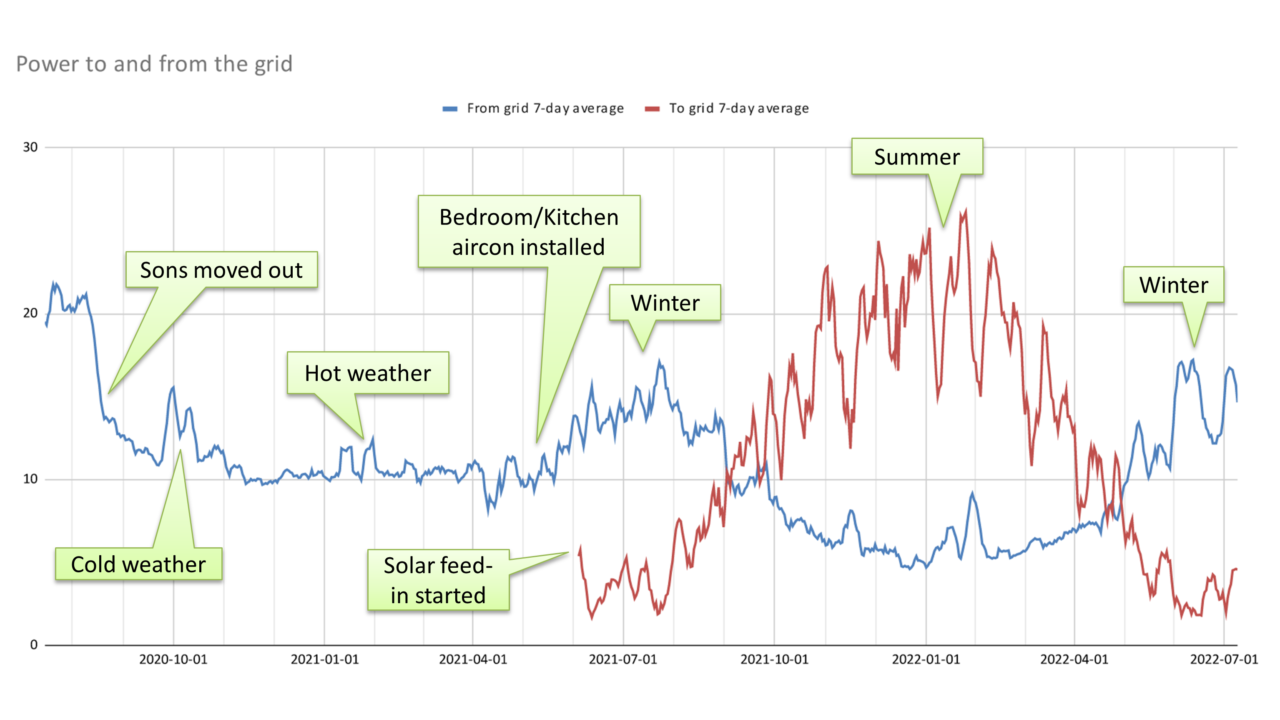
There was a big drop in power usage when my sons moved out in August 2020. From then to the following winter, my usage was about 10 kWh per day when not using (or lightly using) heating/cooling.
Prior to May 2021, I had reverse cycle heating/cooling in the livingroom, but not elsewhere. That month I had more units installed, covering the kitchen and bedrooms, replacing old gas central heating. This has caused my gas usage to drop right off, and my electricity use to increase in winter. That’s good, because gas is not renewable (no matter what the gas industry claims) whereas electricity can be.
Most of the spikes in electricity usage shown above seem to match up to hot and cold weather – this can be seen in the BOM observation data – for instance a run of cold weather in late September and October 2020, and some very hot days in mid and late January 2021.
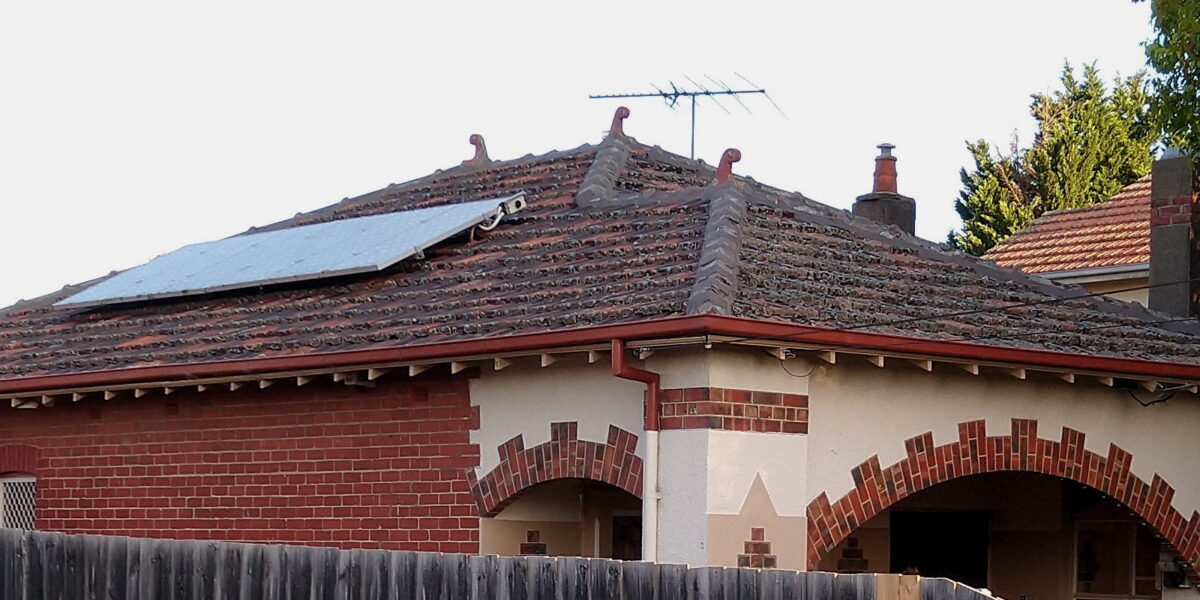
In mid-2021 I had PV solar installed. This has helped reduce the power used from the grid, particularly in summer.
Getting it down to zero during this time would require a battery so energy generated during the day could be used at night. That’s expensive to do at present, but hopefully the prices will come down over time.
From the looks of these numbers, getting my new usage down in winter could be more challenging.
It’s all quite interesting. If you’re in Victoria and fancy checking your own power usage, check the sites below for your distributor.
7 replies on “Tracking your electricity usage”
I looked at ours some time ago and there was little unexpected. The only thing to note was a winter spike between 9.30 and 10.15am when we shower and the bathroom heat lamps are used, along with the dishwasher being turned on.
Worth looking at claiming a free Bluetooth energy monitor through the Victorian government rebate scheme such as Powerpal that connects to your smart meter. You can see to the second live data on how many watts of power your house is using, and see what affect on price turning on or off individual devices has.
Curious: Do you have separate air conditioners (cooling/heating) on the walls in livingroom, kitchen, bedrooms? Or is there a central unit (outside?) with ducts to those rooms? We have gas central heating with ducts.
@Andrew, one of the side effects of solar is trying to run the dishwasher and washing machine during the day if possible.
@Kurt, good point. I have one of those devices somewhere.
@roger, they are separate units, so they can run independently. It works well, though wrangling multiple remote controls is something I’ve got a plan to resolve.
I too have a PowerPal. I found that to make any reasonable use of it it pretty much needed its own dedicated display because starting it up and getting it connected using your normal phone or tablet was a bit of a pain. Best with a dedicated older device that can do the required Bluetooth and be run continuously from the mains. It is not as great as you might hope for for looking at power usage. Because all it does is notice the little flashes your meter makes as it counts energy consumed. So turning on an appliance means the next flash will turn up sooner than it might so getting some sort of hybrid of the original and new rate. The next flash will show the new rate. But the display on the PowerPal is quite granular (15 minutes if memory serves) so you may need to wait quite a while to see what has happened. Something like this: https://www.aliexpress.com/item/32763863798.htm gives you the immediate detail you need for your house, something like this: https://www.aliexpress.com/item/1005002618293537.html can do that for a single portable appliance but not for built in things like RCAC, induction hobs, ovens, ceiling fans, lighting, and IR heating in bathrooms etc.
Our inverter has an additional power meter fitted to the meter box so that it can measure power generated by the inverter (which the inverter could also tell us), power sent to or from the grid, and power used in the house. We can connect to the inverter via ethernet and get the live data from this meter and use it as we see fit. It’s been 9 months now and I haven’t got round to it yet, but I plan to have a computer log the consumption every time it changes by more than a certain amount. Then if I add other sensors such as sunlight, temperature etc, I should be able to do some pretty intense analysis of how we use the power. Does your inverter have a network connection you could use like that?
@Philip, yep my inverter has various stats available via a web portal. I haven’t yet taken the time to truly understand it all!