Many of us have changed our habits during COVID-19, avoiding going out, working from home where possible.
I was wondering how this might be reflected in a few measurable, personal metrics.
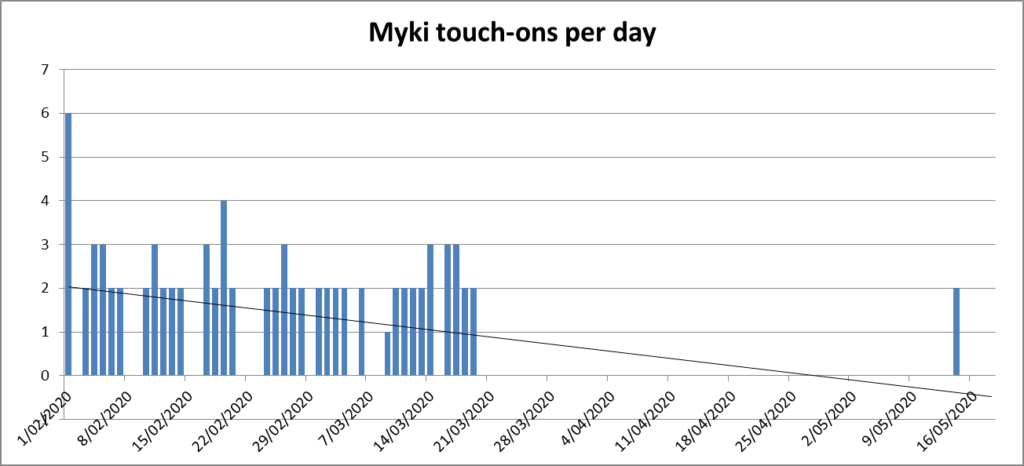
Here’s my Myki touch-ons (per day) since February – which pretty accurately shows how many public transport trips I’ve been making. Almost none. (Is it correct for a trendline to go below zero?!)
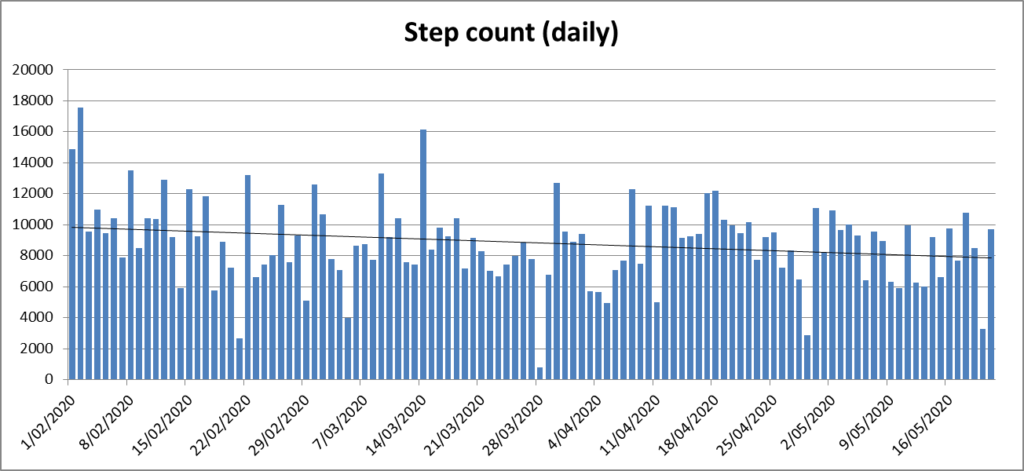
Here’s my daily steps, as tracked by Google Fit in my phone. The trend is down slightly, but I’m trying to maintain it by regular walks around the neighbourhood (morning, lunchtime, afternoon, evening, as many as I can get) – plus longer walks on the weekend.
I think my phone battery was low (on Battery Saver, not recording steps) on 28/3/2020. Poor weather probably accounts for the other low numbers.
Photos: As I get out and about, I often snap photos with my mobile phone. A few make it into social media or blog posts. Here’s how many photos per day I’ve been taking:
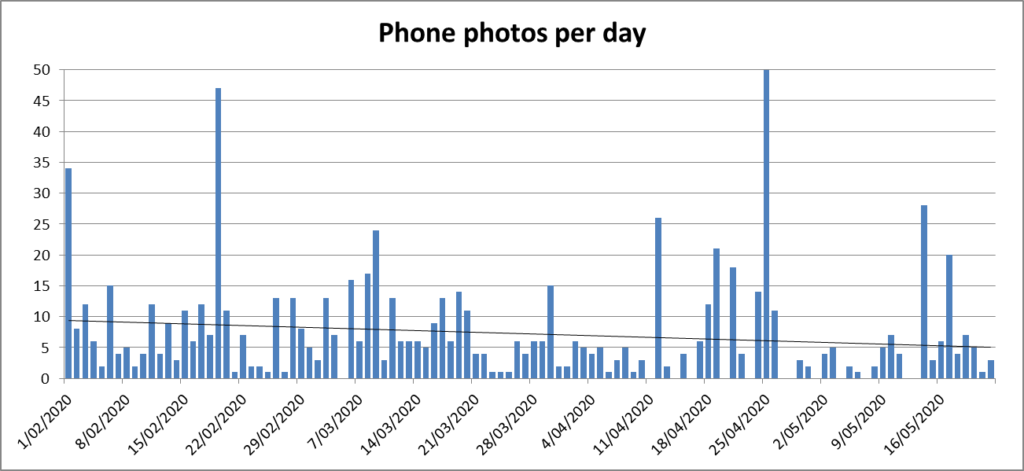
25/4/2020 had more photos than shown here, but I’ve set the graph axis limit to 50 to make things clearer. It actually got to 199, because someone else used my camera to take my photo – I’m guessing the button got held down! Second highest is 19/2/2020, when I visited Carrum station.
The overall trend is down slightly, but the noticeable thing is that it’s become more common for a day to go by with zero photos being taken.
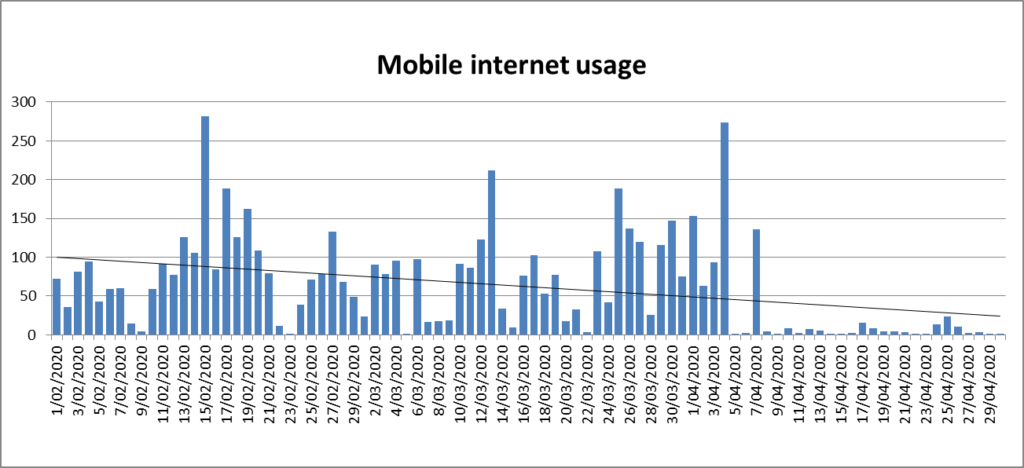
Mobile phone data is something I most commonly use when on the train, or otherwise out. Obviously at home I can use Wi-Fi instead. Here you can see how usage dropped off almost completely (though judging from the numbers, I may have incorrectly had Wi-Fi switched-off in late March and early April).
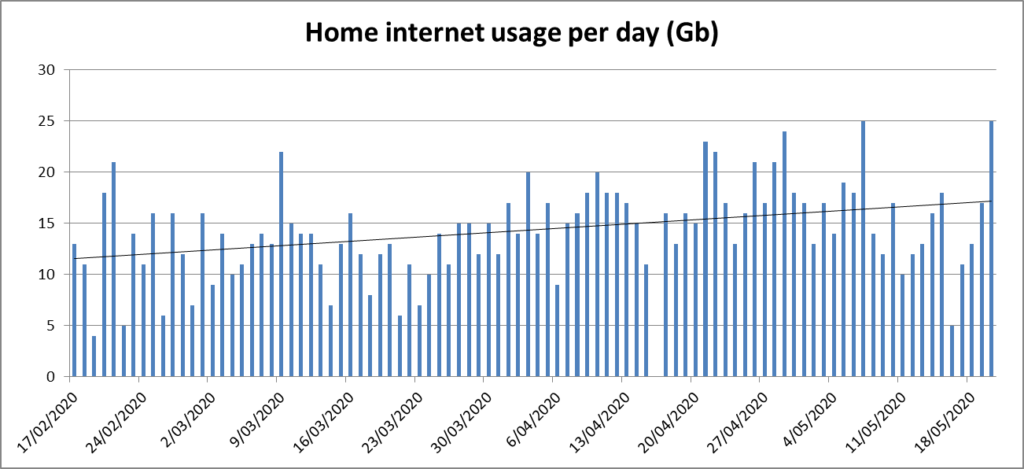
Home internet usage unsurprisingly is creeping up, though perhaps all those VPN/Remote Desktop sessions don’t use as much bandwidth as I thought they might.
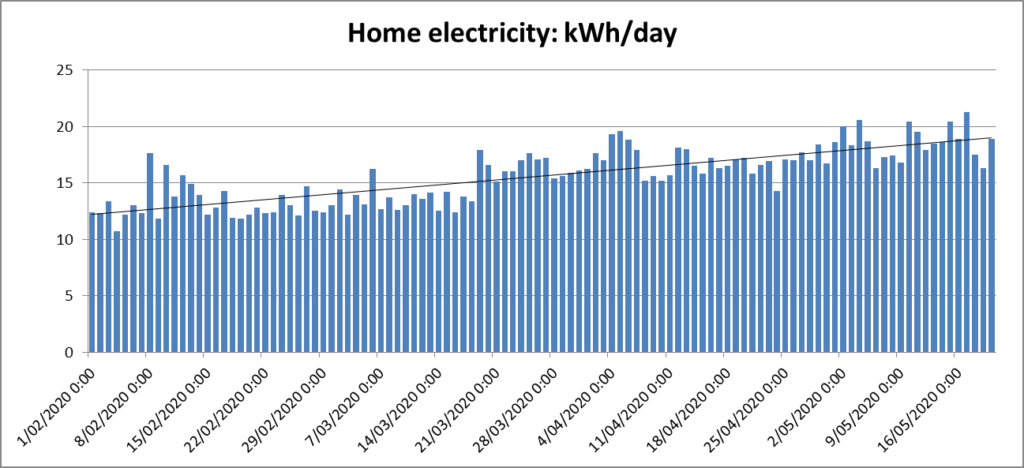
Electricity consumption also climbed from late-March from being at home, though I also switched hot water from gas to electricity at that time.
Finally, here’s my supermarket spending, graphed as a four-week average to make it less spiky. Some items get bought at other locations, but this covers most of my groceries.
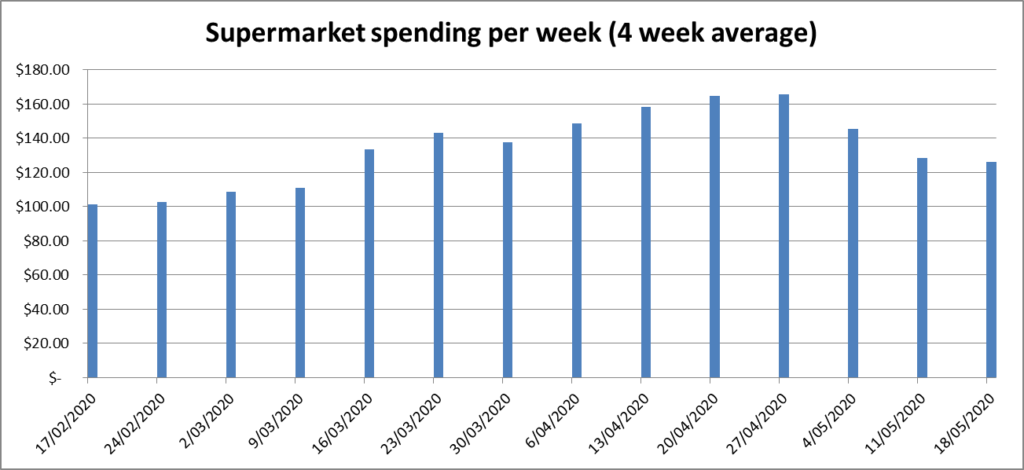
My supermarket spending wasn’t directly affected by working from home – because even if working in the CBD, I usually make my own lunch.
But there was a period when specials and cheaper ranges at supermarkets became scarce, and for many products you basically had to buy whatever was available. I’m lucky enough that I can afford that. I feel sorry for those who normally have to count every penny.
What else could I measure over this period?
Gas use is affected by my switching to electric for hot water, and using the heating as the weather gets cooler. And the bills don’t have enough detail. Ditto water bills.
What other data is tracking you? Lots of things – one of the most eye-opening is the Google Maps Timeline, which closely follows where someone goes.
Personally, I’ve installed the COVIDSafe app. It works well on Android – less so on iPhone at present – and I’m fairly happy with the privacy, given it tracks proximity to other users, not location, and the data stays on your phone until you choose to manually upload it for health authority analysis.
Whether you’re staying home or have to go out, stay safe, everyone.
4 replies on “Some personal metrics”
I haven’t tracked our stats as closely as you, but with two of us WFH now our electricity bill has jumped aobut 30% from circa $80-90 a month to $120 a month. We are saving in other things though, PT being a big one, gym membership on hold, less coffees out during work etc. One of the most noticable things has been our wellbeing – when you cut out 45 minutes commute into the CBD each way you suddenly have a lot more time for other more important things, like daily pilates (done via a mobile app casted to the television), spending more time cooking, more quality time with family. Only downside is my podcast listening has fallen off a cliff…
A very impressive step count. I am happy to get in 6,000 steps. I used to get that number by being out and about but now it is deliberate walking and probably more beneficial.
Great analysis! It’s illuminating to read how other people’s lives have changed due to COVID-19.
As my wife has always worked from home on some days of the week anyway, having me WFH not increase our household costs much.
But our myki spend is essentially zero. We either walk, ride or (now we are allowed to travel afar) drive. Petrol consumption is lower. We don’t eat out (can’t) and since we are both home at 5pm we always make dinner instead of sometimes takeaway.
So I am making a “profit” by WFH, especially sine my work gives me a small weekly subsidy.
@Stretts, I’m listening to more podcasts than ever, while walking!
@Andrew, I’m doing all that walking in part for the exercise, but also to help break up the day, and keep the “home time” and “work time” apart.
@Roger, after a few weeks of all home-cooked dinners, I started getting take away at least once a week to try and help support my favourite local restaurants.