The Age’s Timna Jacks got hold of some bus punctuality figures via FOI, and published this story last week, which is worth a read:
Late every second trip: Life on the delayed 232 bus
The data provides a glimpse of something not normally in the public eye. Regular bus users know that some routes suffer greatly from lateness, but the statistics aren’t usually published.
With Timna’s permission I’ve dug around in the data a bit more to see what other insights can be found.
What’s in the data: Punctuality to within 5 minutes for Transdev routes from 2013 to 2018. What it doesn’t show is service delivery, ie cancellations and short run services, which also influence how reliable and usable bus services can be.
There are also operator-wide average figures for Ventura and Dynson from 2015 to 2018.
Transdev’s best and worst performers
The data had a route-by-route breakdown of Transdev’s punctuality since September 2013, from shortly after they started operations after winning their contract and taking over routes formerly run by Ventura and Melbourne Bus Link.
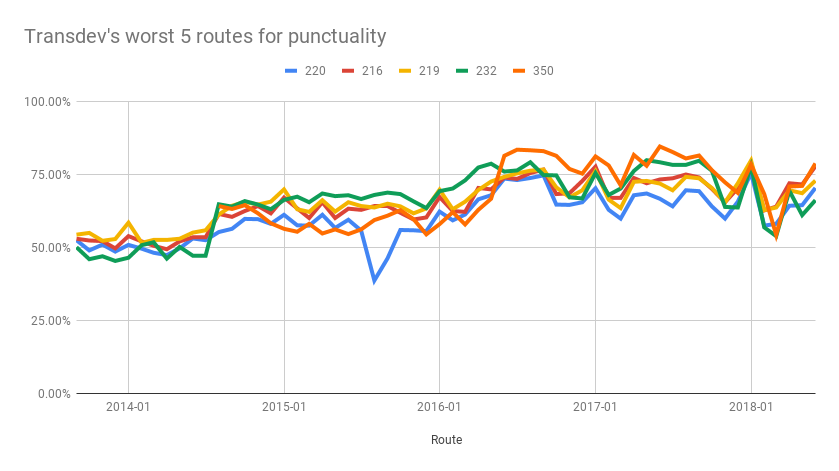
The five worst Transdev routes (out of 47), based on average punctuality from 2013 to 2018:
- 220 Gardenvale – Sunshine (via City) 60.18% punctuality, but “winner” of the worst single punctuality figure, with just 38.7% of buses on time in August 2015
- 216 Brighton Beach – Sunshine Station (via City) 64.89%
- 219 Gardenvale – Sunshine South (via City) 65.58%
- 232 City (Queen Victoria Market) – Altona North 65.75%
- 350 La Trobe University – City (Queen St) 68.77%
The worst three are the long cross-suburban routes, running via the CBD, with almost no bus priority measures along the route. Just in the past few months (after the data ends), these have been split into two, theoretically temporarily, to avoid even worse problems while the metro tunnel is being built… so punctuality is likely to be improving now.
Rounding out the worst five are the 232, which improved in 2014 when the Port Melbourne diversion was removed – and route 350. Both these routes also serve the CBD. In fact 8 out of the 10 worst routes serve the CBD – no surprise perhaps, since that’s where traffic is likely to be at its worst.
(Can’t see the graph? Click here)
Some of Transdev’s routes benefited from timetable changes in 2014, and there was a more thorough change in 2016.
These changes mean there has been improvement, but looking at just the worst average punctuality for 2018 (January to June), the same five routes feature, with route 232 is now the worst, with 64.23% of buses on time.
What Transdev wasn’t able to do was introduce its “greenfields” timetable, which would have made wide-ranging changes, including splitting the long orbital Smartbuses (and some of the cross-city routes) up into more manageable, logical routes.
That proposal would have overcome a lot of the punctuality and crowding issues, but it also would have cut services in some areas, because it was basically a reshuffle of existing resources, where ultimately, more are needed. Labor rejected the plan when they came into office in late-2014.
And the most punctual Transdev routes? Unsurprisingly they’re all in the middle and outer suburbs, and mostly relatively short routes of under 10 km.
- 284 Box Hill – Doncaster Park & Ride 89.55%
- 370 Mitcham – Ringwood 88.21%
- 295 Doncaster SC – The Pines SC 87.69%
- 279 Box Hill – Doncaster SC/Templestowe 86.42%
- 380 Ringwood Loop 85.62% – this is the only route of the top 5 to be over 10km long
Perhaps surprisingly, the “DART” City to Doncaster Smartbuses 905, 906, 907 and 908 all rank in the top third of routes for punctuality. They do have bus priority measures along much of their routes in peak hour, though there are problems with motorists invading the bus lanes on Lonsdale and Hoddle Streets, and little or no enforcement. (And remember, the stats don’t measure cancellations.)
Somewhere in the middle of the pack are the long orbital Smartbus routes 901, 902 and 903 – they do better than one might expect because they have plenty of fat in their timetables at various points along the route.
All of the Smartbuses benefit from long operating hours and relatively frequent off-peak services, which can help bring up the average punctuality compared to routes that run most or all of their services in peak hour.
Comparing bus operators
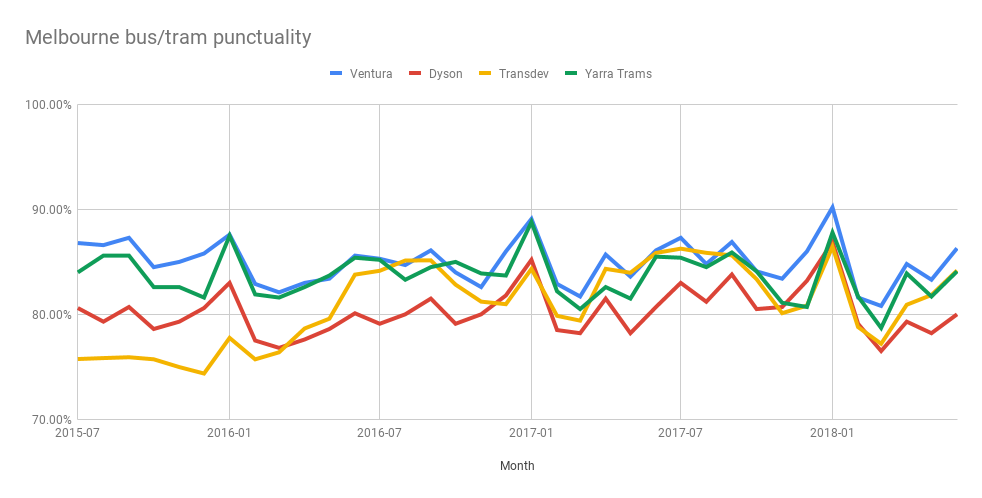
The data also provided operator-wide figures for Ventura and Dyson. Here’s a comparison for those two plus Transdev*, with Yarra Trams thrown in as well:
(Can’t see the graph? Click here)
As you can see, punctuality generally improves for a month in January, as traffic (and patronage) is lighter than usual, despite frequent construction blitzes.
Ventura consistently has fewer buses running late than Transdev or Dysons, but it’s worth noting that Ventura run routes predominantly in the middle and outer suburbs, with none of the inner-city or CBD services which tend to suffer worst from traffic congestion.
Transdev was the worst of the three during 2015, but lifted its game in mid-2016 with timetable changes across most routes. Since then they have on average seen fewer delays than Dysons most months.
So on this measure at least, Transdev has been improving.
Remember: this is punctuality only. The figures don’t measure cancellations, short running, cleanliness, buses catching fire or taken off the road by the safety regulator, or any of those other things for which Transdev Melbourne is notorious.
What more can be done?
On Saturday the State Government announced that 100 of Transdev’s fleet (which is owned by the government) would be replaced by new buses. This should help reliability (provided the operator actually maintains them properly), but may not help with punctuality and other issues such as crowding.
It was also announced that Transdev’s contract would end in 2021 — only one year of the 3 year option is being exercised.
Beleaguered bus operator @Transdev_Melb is promising significant service improvements, after the Andrews government committed $16 million to replace almost a quarter of its fleet. @andrew_lund #9News pic.twitter.com/FxXdsTmuLy
— Nine News Melbourne (@9NewsMelb) December 15, 2018
Upgrading buses is a good idea. Hopefully it’ll bring better reliability. Better passenger information would be welcome. Perhaps they should use the opportunity to start a transition to electric buses, particularly for inner-city routes.
But beyond that, it’s important to take other measures to improve bus services. This could include:
Proper bus priority, with more bus lanes and traffic priority, and enforcement of those measures
More frequent services to cut waiting times and relieve crowding, which is chronic on some routes, and adds to delays
Bus route reform to make more efficient use of fleets and drivers, and make the network easier to understand and cut overall travel times by making routes more direct
Contracts that are structured so appropriate funding is available to properly maintain the fleet, and run the service to a decent standard – this appears to be where the Transdev Melbourne contract has gone wrong
Public performance data, so there’s more transparency. I don’t think it’s a complete coincidence that trams and trains have (some) public performance data, and get the bulk of the attention and investment
And yes, timetable adjustments where warranted – but this should be the last resort, not (as now) the default action when buses are regularly running late. Adjusting the timetable just means making those delays permanent, not actually fixing them.
Buses serve many parts of Melbourne that don’t have trams and trains, and may never get them.
It’s high time the government treated them seriously.
- Note: The overall figures for Transdev have been calculated by using the average of the route punctuality figures. This is not the same as the average across all Transdev services, as some routes have a lot more services than others.
- See all the data here. Got further observations? Leave a comment!
- Marcus Wong also has a post on Transdev today, focusing on recent problems with bus reliability and maintenance
15 replies on “Bus punctuality stats finally public… well, some of them”
Why are timetables attached to bus stops not regularly updated when the timetable changes? Or when obscured by graffiti? And who is responsible for replacing the glass sides of a bus-stop shelter following removal during pavement works? No 510 bus-stop at corner of Moreland Rd / Holmes Street has had both these problems for several months.
I’ve used the western half of the 216/219/220 routes multiple times a week for the past 10 years.
I was surprised to read of their punctuality issues in The Age.
Given the fantastic combined frequency of these buses I’ve rarely had an unpleasantly long wait for a bus.
Even less so now that PTV has real time departure data available on its app!
Who cares about punctuality if there are 12 busses an hour running?
That’s a level of TUAG that is rare in Melbourne!
that being said, I’d totally love for PTV & VicRoads to implement some bus priority and stop rationalisation to improve journey times.
In case of 216, 219, 220 & 232 on take over they all had extremely tight times that meant even when no congestion i.e 10pm Sunday buses could still be half an hour.
So if had deal with such tight run times plus congestion on top that(that vary greatly) and lack priority it is no wonder ex MBL routes did so bad. The extra run time they better but still not great because the delay on these 4 routes in worst spots vary from day to day so even better run time can not get it right.
As for DART I dont think should be suprising. DART has fair amount of bus priority, it can get delays but they vary much less compared to ex MBL runs and as well as every other Transdev route it has had updated run times.
If you extend it to 10 worst over 5 years you find non city routes 215 & 223 on list. 215 might surprise some but goes back to my point about run times that don’t reflect things like Speed limit changes.
This seems relevant:
@David but how did she measures 370? By all stops instead just contract timing points as case with these TDM figures.
Your data is missing routes scrapped in 2014 making total data till mid 2014 look better than it was
The stats should be restructured so that they show the percentage of passengers delivered on time, not the percentage of vehicles. Who cares if three empty buses in the middle of the day hit 100% of their timetable when one crammed full in peak hour is twenty minutes late. Surely with the myki data we can get better numbers than just assuming that all buses are equal
The timetable data would ideally also reference timetabled running speed (eg. 18km/h) vs actual running speed.
Would help show which routes need priority, and which are running “to time” but are hopelessly padded, etc.
Some “poor performers” might actually have quite aggressive timetabling, for example.
@Dave at moment the poor perfoemers do not have aggressive timetabling. 216/9/220/232 did in MBL days but not now. Reason still perform poorly is major delays that vary greatly
Thanks all for the comments. Good point about the ex-MBL routes being particularly bad.
@Recheck, those routes were not included in the data provided to me.
@Daniel when you look at ex MBL routes you see in early days of TDM 215/223 doing so bad for a non city routes where as from Ventura none off Doncaster local expect 270 started off this bad.
I think data in early days just shows how bad runs times were on ex MBL routes. Even 600/922/923 in 60 or low 70s during early TDM days but outside peak these routes were oppoiste to other MBL routes and had early running instead.
Yes, I’m also sick of hearing about “late” inner city 2xx/9xx bus services. At least they run every few minutes for most of the day instead of being perfectly on time but once an hour.
Of course the crappy bus routes such as the 370 rate high for punctuality when no-one in their right mind ever uses them unless given no other choice (if no-one is using them they basically run express, only stopped by traffic lights, timing points, and traffic itself). If the Victorian Government actually enforced the 6AM-9PM minimum service “guideline” for buses, the 370’s timetable would be against the law as with most “coverage” routes in Melbourne.
370 (Mitcham to Ringwood)
Weekdays: Half-hourly, 6AM-6:30PM.
Weekend/public holidays: Hourly, 7:27AM-6:27PM.
370 (Ringwood to Mitcham)
Weekdays: Half-hourly, 6:27AM-7PM. (The first two services are inexplicably timed at 6:27 and 6:57, while the rest depart right on the 30 or the o’clock for the rest of the day)
Weekend/public holidays: Hourly, 8:03AM to 6:03PM.
Until recently, the Sunday timetable didn’t even exist on the 370. The original full-length 270 didn’t run on Sundays either, when the 270 was split the Box Hill half gained a Sunday timetable while the Ringwood half (370) was left unchanged for years.
World War III would be declared if the 216 etc. suddenly started running once an hour and finishing at 6PM, yet for the suburbs beyond the reaches of the tram network, it’s completely normal to have an almost nonexistent bus service and to drive everywhere instead.
[…] punctuality and reliability data is not normally public, despite it having been automatically collected via GPS since 2016 (no doubt the same systems […]
[…] can’t show you bus punctuality data because it’s generally not […]