Cynics have described carpooling as “a transit system with one round trip a day” — which means that while the trip itself may be faster and more comfortable, in terms of scheduling it’s less convenient than all but the very very worst public transport.
Even if you don’t believe that, it would appear that any pushes towards carpooling (which was supposed to be a big hope in reducing pollution, congestion and emissions from cars) aren’t working:
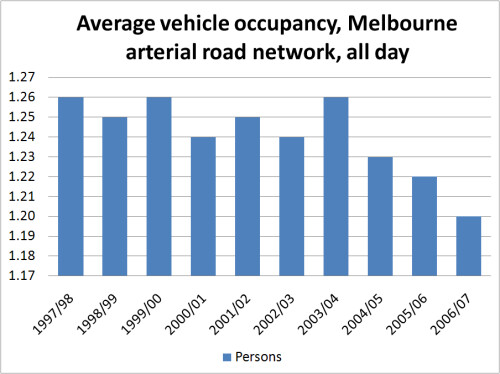
— Source: VicRoads: Traffic system performance monitoring
One might argue that the 1997-2003 up-down pattern could be statistically insignificant, but since then there’s a pretty clear trend in the downwards direction.
9 replies on “So much for carpooling”
I figure it’s a symptom of the way people work now and flexible working hours, as well as Melbourne’s spreading population and the fact you can have people from different socio-economic groups living in the same same street, as much as anything. In the “olden” days, people mostly worked very set hours and you’d tend to have people doing similar jobs in similar areas living in the same places, but these days that is less likely than it was before. As far as say a family of four, it’s unlikely that they would all travel to work/school together in a lot of cases. Dad would drive to work, Mum may stay at home or have a part time drive she drives to separately, and the kids travel by bike/bus/other PT.
Meanwhile in other PT news Hawthorn station was magically mykied up overnight… the machinery wasn’t there last night when we got home, but it’s there this morning! At least the installer contractors seem to work fast! This means all my commonly travelled to stations are now mykied up. Can they switch it on now please?
corresponds with a rise in public transport – maybe people who used to get a lift with their mate have ditched ’em for a train, tram or bus. there’s a different pattern on freeways during peaks, yeah? and during school drop off times, people driving their kids is a growing segment i understand.
im sure its the ‘flexible’ (read: unpaid overtime) hours that people work these days. Whilst it makes sense in the mornings as plenty of people start at the same time, how many can guarentee a finish time, even if its only 30 minutes, there goes your lift home.
maybe if they created a ‘PM Peak’ weekly ticket more people would car pool in the mornings
Yeah, all to do with the rise of flexible working hours. Even that aside, I would never be interested in car-pooling. I’d much rather have the option of changing my departure and arrival times as I see fit, rather than the monotonous routine of having to adhere to someone else’s schedule day after day after day…
no, it aint working but it isn’t going backwards either. .06 people less after 10 years = no change.
Uhh no, it’s a 0.06 (or almost 5%) drop in 3 years. I’d call that significant, particularly if there’s an effort going on to bring that figure up.
Greg, the AM peak figures all seem to be dropping, but PM peak is more consistent.
I’d call a 5% drop statistacally insignificant, for an uncrontolled experiment. Even 10% would be dodgey, maybe 20%. Do you have any knowledge of statistics to say otherwise? (OK, I admit I don’t)
The figures are pretty meaningless anyway, certainly with regards to carpoolling as they are measuring all cars. Less familly trips into the CBD, where the figure might well be over 3.5, more non work trips or more families where only 1 partner works could all explain the trend without really having anything to do with carpooling.
So you’re saying (with no knowledge of statistics) a 20% change might be insignificant? Hoookay… If you want to try and make that sort of assumption, I’d recommend going back to the source data and checking the methodology used to gather it.
Yes, agree it’s a bigger issue than just car-pooling.
Actaully I meant 20% is starting to be significant. I would actaully say for this case it is borderline. But since we neither know much about stats, I don’t think we could even argue the difference between 20% and 10%.
And I did not mean that the variation could just be due to measuremnt errors, which is what I think you thought based on your comment about going back to methodology. I have no doubt that the even the variations from 97 to 03 are real. I just don’t think any of them are significant enough to be an indicator of anything.
Now forgive me for going into a rant. But I don’t think a graph without any sort of explanation (which probably should include some details of methodolgy), and with the axes not startig at zero, shows anything.